Wednesday, December 24, 2014

Split testing website marketing messages with Minitab's Chi-Square % Defective comparison tests

Six sigma techniques have expanded beyond traditional manufacturing companies, into healthcare, movie industry, government and now online marketing.

Split testing (also called A/B testing) is one of the more popular techniques being used today by website developers, programmers and any company with an online presence.

Split testing describes a comparison test that is used to determine what works best on their website, by showing their site visitors different images, colors, phrases, layouts, etc and tracking which ones get the most "interest". Interest can be measured by time spent on a website, percent of clicks on a link or ad, website load time, and even tracking of cursor scrolling patterns.

For example, a website might want to determine what gets the most clicks, a button that says "Free Sign Up" (option A), or "Register" (option B).


After enough visitors arrive on the site (sample size is adequate), a comparison of the click rate is reviewed to determine which one did the best. The click rate is defined as the percentage of site visitors that clicked on the button divided by the total number of visitors who saw that option.

In the image above, you can see that 78% of the visitors clicked on the button when it said "Free Sign Up," but only 34% of the visitors clicked on "Register."

The click rate that is higher would be selected ("Free Sign Up"), and the other option is dropped (or modified again to run another A/B test).

Essentially, split (A/B) testing is a simplified hypothesis test or design of experiments (DOE).

In our example, assuming I had more than 100 site visitors, it is pretty obvious that the difference in the percentage is most likely statistically significant (not due to random chance). However, there may be situations where the percentages will be much closer together. In addition, what if we want to run an A/B/C test (3 options instead of only 2)?

Since the primary metric in split testing is a click rate (proportion), analyzing the split test cannot be done with an Analysis of Variance (ANOVA). Therefore, you either need to run a 2-sample proportions test on each comparison (A vs B, B vs C, and A vs C), or you can try Minitab's Chi-Square % Defective analysis.

We recently performed a split test on our website, using 3 different messages at the top of our website. The top bar in green is a service we used called Hello Bar, which is free for use (one website only).


The three options we used for our message, along with the background color:

  • A: "Check out all the FREE downloads and information" (Blue)
  • B: "5S and Control Chart SPC templates for FREE" (Gold)
  • C: "FREE Lean and Six Sigma Excel Templates" (Green)

After a month of displaying these 3 different messages to our site visitors (done automatically by Hello Bar), we reviewed the data.


  • A: "Check out all the FREE downloads and information" (Blue) = 0.5% click rate
  • B: "5S and Control Chart SPC templates for FREE" (Gold) = 0.8% click rate
  • C: "FREE Lean and Six Sigma Excel Templates" (Green) = 1.6% click rate
From the data, it seems that the last option performed the best. If I was a betting person, I would have predicted the 2nd option (B), but that's why we collect data to make decisions! In addition, as Six Sigma practitioners, we must also ask if these differences are statistically significant, or could the change with more samples?

To run this analysis in Minitab (version 17), we setup our data in the following format:

Using Minitab's Assistant function (highly recommended when unsure what tests to perform), select Assistant --> Hypothesis Tests...


Next, we decide that we want to "Compare two or more samples" (since we are running an A/B/C test). Under that section, since we have proportions (click rate) instead of measurement data (like website speed, time spent on website, etc), we select "Chi-square % Defective"


By the way, if you were running only an A/B test, then you would select "Compare two samples with each other" then select "2-sample % Defective"

On the next screen, we tell Minitab what our options should be assigned to in the worksheet. Under the X column, select "Style" (or whatever field you are using to identify your options).


One thing to note. In the analysis, the "clicks" are considered "defects", but in fact these are good things. Technically, we could have assigned the "non-clicks" as defects. It won't matter either way, as long as you keep track what you define as the "defect".

There are 4 pages that get generated, but the most useful is the Summary Report.


If you start in the upper left, the p-value is 0.031, which is less than 0.05, so we conclude that at least one option is statistically different than one of the other options. The upper right section tells us that the statistical difference occurs between A and C. What it also tells us is that option B is not statistically better than option A, nor is it statistically worse than option C. Therefore, we should definitely drop option A from our Hello Bar message, but we need more data to conclude whether option C is statistically better than option B.

Does that mean the message seems to make a difference? Maybe, because if you were paying attention, we also had different colors for each message, so we have confounded our results with color. Maybe site visitors are not clicking as often due to the color, not the words. Sounds like more split testing is needed!

Split testing is a great tool that has brought Six Sigma analysis into the internet marketing world. I plan to use the term "split testing" or "A/B testing" instead of DOE or experimentation when talking to more tech-savvy audiences.

Have you tried split or A/B testing on a website? Explain what you did in the comments below...

Saturday, September 27, 2014

Don't waste time on a full Gage R&R study until the data says you are ready

We support a lot of small volume manufacturing facilities (delivering low rate, high complexity products), which presents different challenges for implementing Six Sigma.

When you only produce one product per day or per week, it can be difficult to gather a good statistical sample for any analysis. In addition, even if the parts were available, the measurements can be complex with numerous data points, so the time to collect the data for each sample can take from 15 minutes, up to 8 hours or longer!

I'd like to share a best practice we've discovered with Gage Repeatability and Reproducibility (R&R) studies that can help all businesses save time and money with smaller sample sizes, not just those in the low volume production businesses.

I'll assume you have some knowledge of a Gage R&R study. If not, check out this page >>>

Let's assume you need to perform a Gage R&R on a new piece of test equipment.

We recommend a study that will require at least 30 total samples in the experiment. This allows us to gather a significant number of experimental runs to understand what is happening. You may require more, but I would suggest starting with 30, and evaluating the results before adding more runs/samples.

If we have 2 technicians running the equipment (only one piece of equipment), then typically we would take 10 parts, 2 technicians and 3 repeat measurements. That is a standard Gage R&R setup. That would be 10 x 2 x 3 = 60 total samples, which exceeds our 30 sample minimum.

What if each sample takes 2 hours to complete? Our original study will take at least 120 hours. Do you think your company would let you tie up the equipment for that long, and prevent 10 parts from being shipped? Highly doubtful in a low volume environment.

However, we should try to reduce the size of our study, and use another combination of parts, technicians and repeats to get closer to 30 samples. We could select one of the following options:

  • 5 parts x 2 technicians x 3 repeats = 30 samples
  • 8 parts x 2 technicians x 2 repeats = 32 samples
  • 6 parts x 3 technicians x 2 repeats = 30 samples
  • Or any other combination you can think of...

Which one is best? It depends on your situation. If you have a lot of uniqueness in your parts, I would select more parts for your study. If you think technicians may be driving variation, you should try to find a 3rd technician to include. If you suspect repeatability issues, then more repeat measurements may be preferred. This is where the expertise of the technicians, managers, engineers and experts can assist.

Let's select the option with 5 parts, 2 technicians and 3 repeats. Even though we have reduced the study down to 30 samples, it will still require 60 hours of testing to complete the Gage R&R, and we will be holding up 5 parts during that time. That's not what your production team will want to hear.

What can we do?

We suggest you conduct a partial Gage R&R, and evaluate those results before completing the full Gage R&R.

A partial Gage R&R would be a much smaller version of our full study. Instead of 5 parts, we should start with 3, and instead of 3 repeats, use only 2 repeats. We still want at least 2 parts, 2 repeats and 2 technicians as a minimum, so we get some estimates for repeatability and reproducibility.

This would create a Gage R&R study of 12 samples (3 parts x 2 technicians x 2 repeats). Now we have reduced the test time to 24 hours, and are only holding up 3 parts. Compared to the alternatives, that should sound pretty good to your production team.

How can we do this and still properly evaluate the equipment? 

The trick is that we might find enough variation in the partial Gage R&R results that we should stop the study, and go work the issues, before we complete the full Gage R&R. No sense wasting time gathering more data showing the same problem!

However, if the partial Gage R&R show favorable results (% of Tolerance and study variation below acceptable levels), then you will need to complete the full Gage R&R in order to ensure those results hold up with more parts, more technicians and/or more repeats.

The savings will come into effect only if there are problems with the measurement system. If there are no problems, then there will be no savings, as the full Gage R&R will still need to be completed. The nice thing is that you don't need to start over from scratch, you would just expand the partial study until it matched the setup of the full study. For our example, you would simply continue the study with the additional 2 parts, and add one additional repeat run to the study.

Let's see how this works with an example, using sample data from Minitab.

After running the full Gage R&R (30 samples), we come up with the following results (charts generated using the MSA Assistant feature in Minitab version 17):

gauge r&r

what is msa

The results show an unacceptable Gage R&R, as the % of Tolerance is above 30% (calculated at 59.7%), and the % of study variation is showing 63.1%. Most of the variation is coming from reproducibility (technician) at 56%.

The question we want to know is whether our partial Gage R&R study would have detected the same problems with the measurement system.

When we condense the data set down to 12 samples, and re-run the analysis, here are the results.


The results come out very similar!

% of Tolerance (Full) = 59.7%
% of Tolerance (Partial) = 64.5%

% of Study Variation (Full) = 63.1%
% of Study Variation (Partial) = 65.0%

% of Tolerance for Reproducibility (Full) =  56.0%
% of Tolerance for Reproducibility (Partial) =  63.5%

Since the measurement system contains reproducibility issues, we benefited by not running the full Gage R&R study. Now we need to investigate and resolve the technician issues, and conduct another Gage R&R when we feel those issues are resolved.

On a side note, do not run a Gage R&R unless you think it will be successful. If you know there are calibration problems, mismatching of equipment, outdated software installed, worn out parts, and differences in techniques used, then resolve those issues first. Otherwise, you'll have to re-run the study again later, after those improvements are made. The initial study would be a complete waste if it told you things you already suspected would be a problem. There are enough unknown variables inside a measurement system that you should deal with the obvious and known variables first.

After we make improvements to our measurement system, we would still need to run a partial Gage R&R the 2nd time, but again, do not complete the full Gage R&R until the partial Gage R&R shows results that are acceptable. Your 2nd study may find additional problems, or prove that the improvements were not effective, so we should stop and fix those right away.

Once you get acceptable results from the partial Gage R&R, only then should you continue to the full Gage R&R.

Bottom line, do not misread this and conclude that you only need to run a partial Gage R&R. A full Gage R&R is still needed to ensure all the variation in the additional parts and repeat measurements have been uncovered. But, until the measurement system issues are fully resolved, don't waste time doing a full study until the data tells you when you are ready to do so.

This concept can be applied to capability studies as well. Ideally, we would like to have 100-300 samples from a stable process produced from all of our sources of variation in the process, before we calculate an accurate number for capability indices (Cpk and Ppk). That may be easy to do in high volume production environments, but that is very difficult in low volume industries. Even getting a statistically valid sample of 30 is near impossible.

What we suggest is to gather the first 5 samples, and calculate capability. If the small samples show a problem (mean near the limits, large variation compared to limits), that might be enough information to dig into the problem. If the results are good (mean near the target, variation small compared to limits), then you will need to wait until at least 30 samples are generated before drawing any long term conclusions from the Cpk/Ppk values.

Remember, 30 samples is ideal, but 5 samples is better than only one sample, which is better than none at all!

In summary, in order to save time and money conducting a Gage R&R study, we suggest you follow these three recommendations:

1) Setup your full Gage R&R study to run only 30 samples - then decide if more are needed
2) Do not run a Gage R&R if you suspect it will not pass - address known issues first
3) Run a partial Gage R&R first, then if they are acceptable, complete the full study, otherwise go address the identified issues

If you'd like to learn more about Gage R&R studies, check out our training class >>>

Has anyone had experience trying this approach? We would love to hear from you! Add your comments below...

Saturday, September 20, 2014

What does golfing have to do with Six Sigma?

Here at BPI, we are always looking for ways to make Lean and Six Sigma concepts easier to understand for those getting started.

We will be creating a series of videos with examples that might resonate with you on basic terms and concepts. Feel free to use these videos in your training class, or send them to your attendees to help reinforce concepts you've already taught or coached.

The following video puts Six Sigma in terms of golfing, where the distance of the tee shot is being measured, compared to the limits of the golf hole.


The process of teeing off can be evaluated in Six Sigma terms based on how likely the shot will land between two sand traps.

We also explain how to connect these concepts back to the real world, such as in business with a forecasting budget process, with limits of +/- 10%.

Are there good examples you've heard, that you'd like us to capture in animation format? Let us know in the comments below...

Tuesday, August 19, 2014

Myths about Toyota and why this is the improvement book you must read!

Toyota Kata is one of the most popular books in the process improvement community right now (summer of 2014). I've heard it mentioned many times in the past few weeks, so I decided to see what all the hoopla was about. It is definitely worth all the attention! I've read a lot about Toyota over the years, and have visited the Georgetown facility, and taken training and been mentored by former Toyota employees, but this book, written by Mike Rother, has greatly increased my understanding of how lean should be applied.


This is a lengthy blog, so I will provide a brief overview, prior to the detailed review.

Brief Overview

Toyota is the benchmark for how to improve your business, based on it's years of continued success. Toyota has opened up it's doors to anyone curious to learn, but no one has been able to replicate their success. The reason they haven't succeeded is explained in this book. Toyota has mastered the art of identifying and solving problems. All of their lean strategy is an attempt to force problems to rise to the surface, so they can be quickly resolved using a standard problem solving approach. That is the "secret" that other companies are not disciplined to follow.

Most companies do not embrace problems (usually try to hide them), and they do not use a disciplined approach (called "Improvement Kata") to solve the problems when they are forced to resolve them. They master the problem solving technique through coaching from management (called "Coaching Kata"), who are experts in using the approach as they worked their way up the company. Improvement Kata is not easy to see during benchmarking tours, and companies leave the tours focusing on the tools, instead of the reason behind the tools. When they implement the tools, it raises up problems, and most companies see this as a problem, and quickly claim that it didn't work, when in fact it did exactly what it was suppose to do.

Detailed Review

Let's first define kata, since it's in the title of the book.

Kata is a set of routines or methods practiced daily. These are not documented or described, but a way of thinking and behaving that is embedded within the Toyota culture. This is why most companies who study Toyota cannot replicate them, despites decades of trying to "reverse engineer" it.

Often people ask me, why is Toyota studied and benchmarked? Yes, they have their share of problems, so they are not perfect. However, over the long term, they are one of the most successful companies, based on:
• Sales growth for over 40 years, during which US automakers' sales reached a plateau or decreased
• Profits exceeded other automakers
• Market capitalization has exceeded GM, Ford and Chrysler (formerly "The Big 3") for many years, and recently exceeded all three combined
• World leader in sales rank, and is number 2 in the US

toyota production system employees

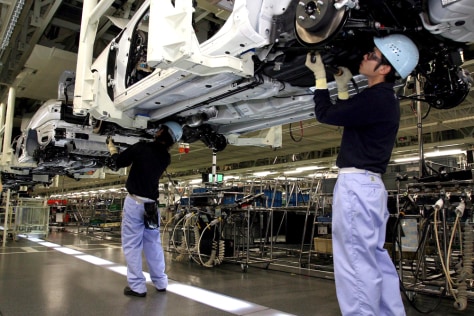
Most companies walk away from a Toyota tour with lean tools that are copied (andon, kanban, heijunka, visual controls, mistake proofing, etc) and they do achieve some success, but how they handle problems is not obvious during the tour. In fact, despite what most people think, Toyota does not standardize on tools and roll them out consistently across their factories, they only standardize on the problem solving approach. The tools change as conditions change, depending on the product and service being performed. If you go back and visit Toyota years later, you will see different tools applied within the same assembly lines. They are constantly adjusting and improving. If companies try to replicate countermeasures (improvements), it will not work in other factories because causes and conditions are different.

That is the intent of this book, to make it visible to us how Toyota achieves continuous improvement and adapts to change through daily behavior patterns and coaching that supports it.

The book is divided into 5 major parts:

• Part I - Long-term organizational survival for Toyota
• Part II - How most companies behave
• Part III - "Improvement Kata" - solving problems every day to stabilize process performance and identify new problems
• Part IV - "Coaching Kata" - how they teach and mentor employees on how to learn the Improvement Kata
• Part V - Implementing Improvement and Coaching Kata outside of Toyota (in your organization)

Differences between Toyota and other companies

Most companies want to have a clear plan to achieve results. Toyota knows that the details of the plan are unclear, and won't become clear until extensive investigation and analysis takes place. They set a target condition (what it should look like), and work towards the target, knowing that the path will be uncertain, unpredictable and failures will occur. Failures are when the learning takes place, and that is viewed as a positive outcome at Toyota. If we already think we know the outcome, then we are biased towards a certain outcome, and cannot truly understand the causes of the problem.  They use the Improvement Kata methodology to navigate through the uncertain and unpredictable path to a solution, and the leaders know the process will work, so they don't need to have a detailed plan. This is similar to a lost hiker, looking to get back on the main route. If you can hear the roar of the traffic (vision), you can head in the right direction, but you only have a flashlight that highlights the immediate danger in front of you (problems) that you need to resolve. You cannot see further than your flashlight, nor do you need to look that far in advance, as long as you are still heading towards the sound of traffic.

Toyota uses a Plan Do Check Act (PDCA) approach to solve problems. The process compares the current results against the target condition, to see where there is a gap. The target condition is not measurable, but instead it is a description of how the process should operate, and does not include solutions or countermeasures (implement 5S or kanban or change layout). Measures can be manipulated, but process descriptions cannot. If there is no target condition, then after evaluating the current state, a short term target condition (1-4 weeks in the future, no more than 3 months) should be defined.
plan do check act toyota PDCA


Next, the process is studied and evaluated to understand why the target condition is not being met. This is 90% of the effort, and still part of the Plan phase of PDCA. Once the true causes are understood, then countermeasures are implemented (Do) and checked to see if they move the process closer to the target condition (Check). If not, then the process is analyzed further until the correct countermeasures are achieving results.  Once the results are achieved, the process is stabilized, and a new target condition is set (Act). Most companies fall short by skipping past Plan too quickly, spending too much time in Do, then failing to check results, stabilize and set a new goal. They quickly look to move away from this process and work on something new, so they can relax for a while. Toyota does not relax, as they are continuously improving the process and looking for the next problem to occur.

In fact, if there are no more problems in the process, then that means there is a problem because the target condition is not challenging enough to reveal the problems. They are striving to achieve a vision of one piece flow, so ignoring problems are slowing up their progress towards the vision.

Continuous Improvement and Adaption

The world and business is always changing. Toyota is setup to continually monitor and adjust to those changes slightly every day. Most companies wait until the change can no longer be ignored, and then they make massive changes to adjust, if they actually decide to embrace the change. Many do not, and fall further behind.

Toyota believes that cost and quality improvements are made in small incremental steps, not major projects, events and activities that occur periodically. Daily improvements from everyone in the company is difficult to copy, which gives them their competitive advantage. If your process is not continually improving, then the process must be falling back into a chaotic state, which is how most companies operate. They periodically try to improve processes with major activities, and the rest of the time the process is slowly falling back into an unstable condition. All processes are either slipping back or being improved.

"…it is better for an organization's adaptiveness, competitiveness, and survival to have a large group of people systematically, methodically, making many small steps of improvement every day rather than a small group doing periodic big projects and events."

Why Action Item lists are bad

Rother describes how action item lists are very common in most companies except Toyota. However, most of the actions are just adding more confusion into the process in an uncontrolled manner, pulling scarce resources in different directions, and not part of a structured system of small, incremental improvements. Toyota strives for only one change at a time, to allow the cause and effect to become clear, not multiple changes at once. Designed experiments (DOE) can handle multiple changes, but it requires expertise to develop a DOE, and that complex approach prevents all employees from experimenting every day. Changing one thing at a time seems slower, but when the feedback is quick, the next change is also quick, so the entire process overall is faster. We can find plenty of actions to take to improve, but Toyota only addresses the problems that are preventing them from achieving the target condition. Most action item lists are just ideas for what could be done, that may or may not help achieve the target, because the analysis and investigation has probably not been done to determine the correct solution (countermeasure). Toyota also has many problems to solve, but only works on the immediate problems that are preventing them from achieving the target condition. Most companies don't have the patience to wait for the analysis and investigation, and instead reward action that is taken immediately, not results achieved in the future.

Action item lists can exceed 100 or more tasks after a non-Toyota lean event

Long action item lists do not lead to more improvement, they give us a false sense of accomplishment, and can take ownership away from the team ("I completed my actions, so it's not my fault the process is still broken"). In fact, once a few changes have been implemented, it may eliminate the need for other actions on the list, yet they still get implemented anyways. Now we have a new process completely that we aren't sure if it is better than the previous process.

Toyota focuses on one piece flow, not making schedule

Most companies focusing on "making production schedules" but Toyota focuses on continuously improving the process. "Making production" drives companies to hide and work around problems. "Continuously improving" drives Toyota to find and remove problems, so the chance of making production in the future is more likely. By focusing on stabilizing and continually improving the process, the outcomes will naturally come to fruition, instead of people  "firefighting" and performing heroics to make schedule. Most companies manage to the outcomes only, focused on results, not the process that drives the results and how they were achieved.

Toyota considers it a negative if problems are hidden or not discovered, so they setup their processes to expose weaknesses quickly and often. This is counterintuitive to most companies, who want to achieve short term results like "make production schedule" only, and think they can replicate those results over the long time without addressing the root causes of the problems. Toyota cannot manage the process if the problems are not visible, as they realize they won't be able to achieve consistent results in the future if the problems are hidden.

Rother gives examples of how attitudes around process changes can be improved. When suggesting countermeasures, he is often met with statements like "let's see if this works." In Toyota, the changes are setup to fail in order to identify problems, so he tells companies he works with that that they are right, it will not work. He suggests you change your company's mindset, and ask them to consider "what do we need to do to make this work?"

Problems at Toyota are not viewed as good or bad, simply a problem that was expected to occur on their way to the target condition. They do not blame operators for problems. They assume that people are doing their best, since they feel that changing out people in a process will likely result in the same problem occurring (most problems are system issues), and teamwork is needed to solve problems (not pointing fingers). That being said, they do not have a laid-back attitude of problems, quite the opposite. It is a diligent focus on solving problems using the Improvement Kata.

Toyota and setting a vision

Toyota uses a broad vision to help move the company in the right direction "One piece flow at lowest possible cost". This helps align the company, especially when departments argue about who will need to take on some inefficiency to help the overall company become more efficient. The example that Rother shares is a logistics manager trying to optimize their process of delivering parts to the factory. The improvement idea presented by the team was to make Logistics unpack and present the parts to the factory, and deliver  more frequently in smaller batches. This takes more time, and Logistics see that extra work as waste and slowing them down. However, to the overall process, it's less waste to the factory, which is the best decision overall. Without a vision, the departments will struggle to determine who should take on more waste in the short term for the betterment of the entire value stream, and to help move the company towards the vision.

The vision also keeps teams from working on the wrong problem. Another example provided was the situation where a team needs to increase the number of machine setups, to strive closer to one piece flow. This change will increase the number of setup checks and quality paperwork. Instead of looking for other solutions (because that will increase these tasks), Toyota will proceed with the change because it helps move them closer to their vision. They quickly shift their focus to reduce the impact of the additional setup checks and paperwork, instead of looking for different solutions.


This concept of letting the goal drive activity also carries over with Cost Benefit Analysis and ROI calculations. Instead of using it as a gate for taking action or not, Toyota only uses these financial analyses to help decide which solution is best, or what needs to be done to make it more feasible. If the solution is moving them closer to their vision, then it needs to be done. The analysis is just supporting how to get there, not whether it should be done or not. If the payback is too long, then alternative solutions must be developed to reduce the cost, so it will be more favorable financially. When teams are empowered to come up with more cost effective solutions to support the vision, they have seen impressive results.

Process management vs management by results

Toyota manages the process, whereas most companies manage the results only. If you manage to results, there are many ways to achieve the outcome you want, and most of those ways are detrimental to the business and create a false sense of achievement.

For example, if you want to achieve your sales output for the month ($500,000), you could either:

• produce what the customer wants by having each product deliver on time as planned (good)

OR

• build more of the same items, in hopes that enough will pass test and inspection to complete the sales demand, in order to work around the quality issues, which increases inventory (bad)
• deliver partially completed units to the next process, then recall them early next month and complete them, so you can get the sales credit (bad)
• move resources to higher cost items and deliver more of them, to increase the total output dollars, even if they aren't due yet, which increases inventory and robs the work from the next month (bad)

Ford influenced Toyota?

Toyota adopted many of Ford's assembly line and conveyor system approach, but built the flexibility and problem solving aspect into the model. They are constantly striving to achieve a conveyor system for every product, which is what Ford was trying to achieve (although with only one product). Rother goes through some history of Ford and Toyota and how they developed into the company they are today. Rother also explains that most management practices utilized in companies today are not actually flawed, but need to incorporate continuous improvement and adaptability in order to align with Toyota and keep up with changes in their industry.

Ford Highland Park had elements of continuous flow in the early drawings
Lean tools are temporary countermeasures towards the vision

Common lean tools like Heijunka (Leveling production), kanban (pull systems) and supermarkets are viewed by most companies as ideal states (after they tour a Toyota facility), but Toyota views them as temporary states to help them achieve their one piece flow vision. The real intent with these common lean tools is to create a target condition, so that the process can be evaluated against it, and problems can rise to the surface (when the process fails to achieve the target). Instead of setting up a schedule that is achievable in the short term (like most companies), Toyota will establish a schedule that is not achievable, and work the issues so that it will eventually be achievable. They will then remove the temporary systems (kanban, heijunka, supermarket, etc) so they can continue to move towards one piece flow.

Pareto charts are overused

Pareto charts should not be used as often as they are. They tend to be utilized far too late, after the problems have happened, and when the causes are no longer around to observe. Many times, the "Other" category is the biggest issue on the chart, which still requires additional analysis or data collection. Toyota feels it is better to solve problems as they come up, as you will eventually encounter the biggest and most critical problem, rather than spend time analyzing old data in an attempt to identify the biggest problem. Old data means old information about what happened. Toyota focuses on quick responses to problems as they occur, when the root cause is still able to be found.

Countermeasures are temporary only

Toyota looks for temporary solutions, in order to continue further towards the target condition, instead of coming up with perfect solutions that takes weeks, months and lots of money to implement, and expecting them to be in place for years. If a team is continually improving, today's solution may be improved upon tomorrow, so why spend lots of time and money on something that might change again. He relates a personal example of how a team he worked with spent lots of money and changed priorities for many departments to expedite a new rack system, only to  request changes to it the next week.

The Five Questions

Rother describes the 5 questions, which are at the heart of Improvement Kata.


When done correctly, using PDCA and comparing the current condition to the target condition, the countermeasure will become obvious, and it will often times be simpler, easier and more effective than expected. Rother provides an example of a damaged fan blade that resulted in tightening a screw on a fixture, instead of a complicated mistake proofing alignment device or additional operator training that was initially proposed, before the full analysis was completed.

Employee empowerment not what you think

One misconception about Toyota is that the lowest level employees are empowered and given time to solve problems. They are empowered to provide input, but other team members actually observe the process and solve the problems. The operators are expected to follow the standard, and pull the andon cord when they encounter problems. If they spent time working on solving the problems, that would prevent them from stabilizing the process and becoming experts on the standards. They also do not have improvement experts, since everyone's job is to solve problems by using the Improvement Kata, that they were taught and coached on how to follow.

Coaching and mentoring

When mentoring employees on the Improvement Kata, Toyota makes sure that the mentor does not suggest solutions, but instead only asks leading questions, and makes sure the next step proposed by the mentee is logical. If not, then the mentor provides suggestions and helps them through the next step. If they have a better idea than what the mentee suggests, but the mentee is able to move towards the target condition with their own solution, then the mentor cannot suggest their idea, otherwise it ruins the relationship. It would fall back to the mentee wanting to constantly ask "tell me what to do" and not learning how to do it themselves.

They also suggest that a written document (A3) should support any coaching sessions. Otherwise it's too easy to divert from the target condition and get off track. Keep mentoring sessions at 15 minutes to keep the mentee focused on the next step only, not jumping too far ahead, and they encourage them to increase the frequency of coaching cycles. The mentoring should take place often but for short durations. A good mentor-mentee relationship will meet multiple times per day for minutes at a time, instead of on set schedules (one hour per week). If the mentee is not successful, then the mentor is not doing their job, and should use Improvement Kata to figure out why. It is imperative that the mentor take ownership in the outcomes of the mentee, so they are both accountable for results.

"If the learner hasn't learned, the teacher hasn't taught"

How should companies implement Improvement Kata?

For companies to begin to adopt Toyota's kata practices, consider starting with Toyota's vision of "one piece flow at lowest possible cost," since that can apply to any business.

Rother provides a great list of common obstacles that companies encounter that differ from Toyota:

  • Using action item lists
  • Senior leaders struggle with internalizing the 5 questions
  • Using PDCA, there is too much "do" but not enough "check" and "act"
  • Jump to solutions and skip over detailed analysis and observations
  • Mentees trying to guess the solution that a mentor has in mind, when in fact, the mentor does not know the solution in reality
  • Not comfortable with not having a clear path to a solution
  • Repeating steps (repeating go and see, more analysis) is viewed as a negative or error, when in fact it is part of the learning process
  • Don't realize it is a new way of managing, not additional work
  • Spending too long coaching at one time, instead of smaller focused efforts

This book could have been titled "The Toyota Secret" as it clearly explains why Toyota has been so successful, but why most companies cannot replicate what they've done.

If you are just starting out in process improvement, or are an expert or consultant, you will find this book very beneficial, and will want to read it more than once, in order to make sure the message and recommendations are embedded in your memory.

Click here to order Toyota Kata from Amazon >>>

Friday, July 18, 2014

Six Sigma for Small Business - Book Review

One of the common complaints I hear about Six Sigma is that it is only for big businesses who can afford to invest in getting started. They hear stories about the cost to train a Green or Black Belt, and assume that it would not work in their own business because they are "too small."

I was intrigued by the book, "Six Sigma for Small Business" by Greg Brue (involved with GE's Six Sigma initiative). I was looking for ways to communicate with all businesses how Six Sigma concepts apply to everyone, not just Fortune 500 companies. If you've studied Six Sigma for any length of time, you'll hear all the reasons why it won't work in certain processes, businesses, organizations and industries. All of these reasons are completely false, and I often spend significant time trying to give examples of how it does apply to what they do.


Brue provides a list of common myths about Six Sigma, and his response to them:
  • Only applies to large companies
  • Only applies to manufacturing
  • Requires outside consultants and experts (Black Belts)
  • It is a complicated methodology that ordinary people do not understand
  • It overlooks customer requirements
  • It is a repackage of Total Quality Management (TQM)
  • It is an accounting game with no real savings
  • It is only about training
  • It is a "magic pill" to fix problems with no effort
Once companies are able to get past these myths, then they are willing to see the value it can provide.

There are a couple quotes about Six Sigma that can be used with small businesses, to help them understand why they need to implement a program.

Six Sigma is about "using science and an established set of steps that will give you the bottom-line results you and your employees want."

"Six Sigma is all about identifying and fixing problems that lower costs, improve quality, and raise your bottom line."

What company could argue with that logic? I would add that the customer wants and needs should also be included in these quotes, but I think it's a good way to summarize how Six Sigma can be beneficial to any business.

One reason small businesses NEED to have an improvement program is that they are competing with larger companies, and most likely are more expensive (due to scale and volume pricing). Therefore, small businesses cannot afford to have quality and customer satisfaction issues, whereas larger companies can afford more issues because they can still retain customers with lower prices.

He also provides an interesting Sigma level scale that relates to employee empowerment, that is another key benefit of an improvement initiative.


He also provides a table for different sized companies, showing who should fill certain key Six Sigma roles, and how many people based on your employee size. For example, a business with $3-7 million in revenue with 10-50 employees should have the following roles:

  • Champion: President/owner
  • Master Black Belts: Outside expert, or experienced Six Sigma employee
  • Black Belts: 2-3 employees 100% dedicated
  • Green Belts: 1-5 employees 20% dedicated
  • Project Team members: 6 member project team

Brue also gives some real-world examples of Six Sigma tools and ways to simplify them, such as:

  • Quality Function Deployment (QFD): It can be a complicated tool to use, so he provides a simplified template (provided in book) to help businesses clearly understand their customer needs, without making it too complex.
  • Gage Repeatability and Reproducibility (R&R): Checking the accuracy of grocery check-out lines to see if each cashier gets the same total
  • Correlation Analysis: Without calculating an actual correlation coefficient, you can use his technique for outlining the shape of the pattern on a scatter plot, and using the ratio of length and width to estimate correlation. The formula is provided in the book.
  • Design of Experiments (DOE): He provides a simple example of DOE using shower water temperature based on hot and cold knob settings.

There were a few tips that were provided that work well for small businesses:

  • Balance the amount of training and projects with the need for results. It doesn't have to be a full immersion, but letting projects drag out and not freeing up time to work on them will quickly kill your Six Sigma program. Do as much as you can afford to do, with the idea that you'll recoup that investment, since that is what you are doing, investing in your people.
  • To reduce training costs, piggyback your training with larger companies in your area. Many are willing to help the community, and if they have an internal course, there is no extra cost to them. They might also offer some of the experts to help your business get started. Local community or technical colleges offer less expensive training. There are many inexpensive online Green and Black Belt training courses to choose from. A last resort should be to build your own training material.
  • Use Excel add-in programs, such as Snap Sheets or SigmaXL, instead of starting with Minitab or another more expensive software. This might depend on your training curriculum and what package they use.

I was hoping for more tips and tricks specifically for small businesses, but I still feel this is an excellent book on Six Sigma. I would recommend it to anyone looking for a good comprehensive Six Sigma book for beginners, and especially for those working with or inside a small business.

Learn more about the 'Six Sigma for Small Business' book on Amazon >>>

Tuesday, July 15, 2014

Tips and tricks for more efficient and effective PFMEAs

Process Failure Modes and Effects Analysis (PFMEA) tables can be a powerful tool to identify potential failures in a process, and to prioritize which failures should be improved first. However, the effort required to complete a PFMEA can take many hours, which costs money. 

Based on our experiences with PFMEAs, here are a list of tips and tricks for making them more effective and efficient. We will break the information into three categories: Forms and Templates, Efficiency, and Effectiveness.

Forms and Templates
  • Break out the process control column from the detection control column. Sometimes they are contained in the same column, and the teams often focus too much on the detection and forget to talk about prevention activities in place. We would recommend having the columns in this order: Cause of failure mode, process controls, occurrence score, detection controls, then detection score.
  • Create a new column for Severity x Occurrence ranking, to identify internal rework cost issues (high impact and it happens frequently, regardless if we detect the failure in-house). Typically, teams rank risks by RPN only, but that is only assessing the risk of external customer escapes.
  • Consider adding another category for cause category, based on the fishbone diagram (Machines/tools/equipment, Methods/Processes, People/Personnel, Materials, Environment, etc). The PFMEA team can summarize the type of causes, and that information can be summarized and reported to identify systemic or higher level issues. If machines is the highest category, then the team should identify a project to look at machine preventative maintenance or equipment calibration updates.


Efficiency (complete PFMEA faster with fewer people)
  • "The more; the merrier" is not a good approach for conducting a PFMEA. Instead of having a larger team involved in the event just in case certain team members might be needed, invite only the core team, and have others as "experts on call". When the team runs into an issue, highlight the cell by color to identify who needs to answer the question. Then bring in each expert as needed, and review the questions for them all at once.
  • Before the PFMEA session begins, enter the failure mode and process steps into the form, so the team doesn't waste time watching the facilitator fill it out on the screen.
  • Don't let the team get hung up on one point differences in scores. Instead, consider flipping a coin, have someone make the tie-breaker decision, vote using majority rules with the team members, or always select the highest score (round up).
Speaking of failure modes, this coin flip controversy cost Pittsburgh the game. 
  • Before diving too deep into the exercise, scope the overall effort ahead of time. Consider evaluating Key Characteristics, Critical to Quality (CTQ) or Most Important Requirements (MIRs) only, instead of trying to assess every requirement. The idea is to start with the most important risks, so the biggest risks get identified as early as possible. Often times, the teams start to dwindle over time, so address the biggest issues when the momentum and excitement is highest.
  • Start with listing all the failure modes, then group the failure modes together and score them all. This helps align the team with the proper severity score. Next, list all the detection controls and detection scores (that align with the failure modes). Next, brainstorm the causes of the failure modes, then list the process controls and then score the occurrences (to help align the occurrence scores).
  • Keep sessions between 2-4 hours long. Over 4 hours can be tough for the team members to keep attention. Less than 2 hours is inefficient, since it takes some time to get setup and calibrated, and requires scheduling many more sessions, which increases the chance of people not attending.

  • To keep the team from digging deep into solutions during the scoring, add notes and ideas into the Improvement Actions column, so the team can move on to the next item.
  • Keep track of attendance and hours for each PFMEA session, so actual costs can be captured. There is often overestimates of PFMEA cost, so this data will help dispell myths. Ideally, your company will begin to create estimates for how must each PFMEA will cost based on size and magnitude of the effort.
Effectiveness (Identify more potential failures and causes, and make analysis more complete)
  • Bring in the physical product, forms, software (view on screen), etc that is being discussed, so the team can physically see the process. If possible, perform the PFMEA right in the process area, so observations and questions can be answered quickly by the right people.
  • Align the failure modes with defect categories in your quality system, and align your process steps with process step names in your business system or documentation.
  • Fill out as much detail as possible into each column, such as document and reference numbers. Often times, what was written down was a summary of the discussion, and teams struggle to remember what the statements mean when the read it days later, and it helps others not involved in the sessions to understand what was discussed.
We prefer this level of detail, not just "friction" or "excess weight"
  • After actions are implemented, in order to reduce occurrence scores, there must be a process control (training, fixture, mistake proof device, procedure change, etc) implemented. To reduce detection scores, there must be an inspection or test implemented.
  • Spend time calibrating the team on the scoring tables at the beginning of each PFMEA session (especially the first session). Don't speed through this process, or you will struggle to keep the team aligned.
  • Provide scoring handouts for each team member, or post the scoring on the wall. Allow extra time to go through the first couple lines slowly with the team.
  • A regular review of the PFMEA should be setup as a recurring meeting (suggest monthly or quarterly), to force the teams to get together and update the PFMEA.
  • Don't use a cut-off RPN score criteria for actions, instead work on the top risks only. Teams can be biased in their scoring when trying to stay below a value (such as 150 or 100) that require actions. Some processes may have many actions over that threshold, but the team cannot address all of them at once. However, AS 9100 requires that the criteria for how the team decides to take action should be defined on the PFMEA. We would recommend taking action on the top 5 RPNs, regardless of score.
  • Customize the PFMEA ranking tables to align with your business, to minimize scoring differences between teams. Especially if conducting a PFMEA in a service or transactional process, or an industry other than manufacturing (where PFMEAs were developed, and most scoring tables were designed for). 


For more information about PFMEAs, download our training material or FMEA Excel template

Sunday, June 29, 2014

Which lean book is better? Toyota Way or Toyota Kata

I saw a recent interview with author Jeffrey Liker about both of these books, and I think he does a great job summarizing what each book can be used for.

He explains that "The Toyota Way" provides companies with the "ideal state" vision. It explains how they should operate (similar to Toyota), and how to think differently about what is possible for their business. It is a powerful book about how Toyota operates.

The Toyota Way is the first book for a general audience that explains the management principles and business philosophy behind Toyota's worldwide reputation for quality and reliability.

However, for most companies, that is quite a stretch from where they are today. Many companies end up rejecting the entire idea based on many factors (not our industry, different business model, different constraints, "we're different," etc). The ideal state seems so far off, that it seems impossible for them, so they shut down and ignore the concepts completely.

In order to close the gap from current state to ideal state, Mike Rother wrote "Toyota Kata". Consider it to be "future state" for companies.

Drawing on six years of research into Toyota's employee-management routines, Toyota Kata examines and elucidates, for the first time, the company's organizational routines--called kata--that power its success with continuous improvement and adaptation.

With an emphasis on problem solving at the employee level, any company can implement these practices, and not feel overwhelmed.

So which book should you start with? Similar to many lean events we run, we need to understand where we are headed and why. I would recommend starting with "The Toyota Way" so companies can see the ideal state. Then, introduce "Toyota Kata," so they can see how to move from current to future state, while still keeping an eye on ideal state.

Watch the full Jeffrey Liker interview below:


What other lean books have you found useful to your company?

Saturday, June 21, 2014

"Six Sigma on a Budget" book review with simplified tools

One of the biggest issues with companies deploying Six Sigma is the upfront cost for training. For a company of 1000 employees, most consultants would recommend 10 Black Belts and 100 Green Belts. Although it can be an effective way to gain critical mass, the price tag can scare many companies away.

There are many ways to cost effectively implement Six Sigma, without all the upfront costs. In fact, we prefer a more targeted approach to process improvement, not a mass training that cannot possibly be supported or managed properly.

Based on these issues with Six Sigma deployment, I was intrigued by the book "Six Sigma on a Budget: Achieving More with Less Using the Principles of Six Sigma"


Despite the title, this book is not about how to deploy Six Sigma cost effectively. We utilize an approach where we identify a target area, focus on making that area successful, then roll out to the rest of the areas in a methodical manner. Please contact us for help with this approach.

Instead, the book focuses on how to use the Six Sigma tools more effectively, to increase utilization with employees and reduce training time. The author, Warren Brussee, went through Six Sigma training at GE, but felt there was a better way to train, without as much technical details, with an approach that provides a more effective use of the tools.

The book covers the basic concepts of Six Sigma, and says that you only need high school level math and Excel software to achieve Green Belt level skills from this book.

Brussee presents many different simplified versions of existing tools, to show how to easily utilize the concepts, without the complexity and effort.

Here are the tools he presents as "Simplified," along with a description on how it differs from the traditional application:

  • Quality Function Deployment (QFD)
    • Only uses the two comparisons between customer needs and design options (items). The design items are grouped to help determine priorities. Each customer need is ranked with a 1 to 5 scale (5 being safety or critical), and each design item is ranked with a 1 to 5 scale (5 being that it addresses the customer need completely). The design option that ranks the highest is the best approach for the team. This reminds me of a Cause and Effect Matrix.
  • Failure Mode and Effects Analysis (FMEA)
    • Only lists the concerns (risks) on the left side column, and lists the potential solutions across the top, using a similar scale as QFD.
  • Process Flow Diagrams (PFD)
    • Uses only a few symbols, and only displays four process types: assembly, transfer, measurements, quality judgments
  • Correlation Tests
    • Instead of running correlation statistical tests (generating a correlation coefficient), he suggests using visual charts to stack different factors on top of each other, using the same timeline on the x-axis. If you can visually see how variation aligns with other factors, then there might be a correlation. I've seen these simplified charts in Excel, called sparklines. Learn more about sparklines >>>
  • Gauge Verification
    • Suggests using "master" parts that are centered near the target (middle of the specifications), then having 3 different operators/machines measure the master part 7 times each. This will provide 21 measurements, of which repeatability and reproducibility can be calculated.
  • Control Charts
    • Uses a simpler chart to identify issues that is more intuitive and understandable to workers. Instead of plotting a single data point, a vertical bar is plotted showing the average of the last 11 readings, and the spread represents the variation of the 11 readings. The bars are colored coded based on whether they exceed control or tolerance limits.
  • Design of Experiments (DOE)
    • He discusses using a 2-level factorial DOE with 5 replicates (i.e. a 2 factor experiment would require 2^2 x 5 = 20 samples), and to compare the average and standard deviation results to each combination, to find the settings that have minimal variation, and that is closest to the nominal results.

Overall, I would recommend this book if you are looking for "simplified" ways to teach and utilize the tools listed above (QFD, FMEA, PFD, Gage R&R, SPC, DOE).

To order the book or read the first chapter, visit the Amazon page for "Six Sigma on a Budget" >>>

Monday, May 26, 2014

List of supplies for Lean Six Sigma Event Facilitators

If you are just getting started leading or facilitating lean or six sigma events, you need to be prepared with a list of kit supplies to have during the event.

Each event will have different objectives and require different supplies, but here is a list of items to consider (Note: Amazon affiliate links):

Write On - Cling On Reuseable Static Easel Pad - Better for the environment than paper easel pads, but if you want paper, at least use the recycled paper version, and you might need a easel pad stand.


Post-it Recycled Sticky Notes - A must have for any event. Select the recycled paper version.


Digital Stopwatch - If you are doing anything related to time, you need real measurements from the process, not data from a system. Timings also allow you to see the waste first hand.


Clipboard with calculator - Useful for taking notes, and doing quick math, such as takt time, yield, or DPMO.


"Butcher" paper roll - Good for taping to wall for process mapping with post-it notes


Recycled Perforated Note Pads - Good for taking notes during walk throughs, tours and process reviews


Colored pencils - Useful for showing multiple flows on spaghetti diagrams


Flip chart markers - Write on dry erase boards or easel pads


Name tents - These are reusable with dry erase markers, to save paper.


Other items that you will need, but should not require ordering online:
  • Scissors
  • Rulers
  • Tape (masking and scotch)
  • Pencils and pens
  • Digital camera - someone should have a smart phone that takes good pictures
  • Tape measure
  • Glue sticks
  • Sharpies (permanent markers) - bold enough so words are legible when posted on the wall
The following items are not required, but you might find them helpful:


Pedometer - Easy way to capture actual walking distance of people, instead of what it should be on paper


Label maker - For making signs and labels in work area


Laminator - For making signs to hang in work area or metric sheets that can be wiped clean each day


Measuring wheel - An easier way to calculate square footage and distance than a tape measure


These items above are generic for most events, not specific to a VSM or 5S event, which would require additional items, such as VSM data box sheets or 5S red tags.

Did we forget something important off the list? If so, leave a comment below...

Thursday, May 8, 2014

6 resources for Six Sigma Black Belts to save time and improve effectiveness

Sigma Black Belts and Master Black Belts often have too much on their plate, especially when there aren't many other Black Belts in your organization.

Here are some resources that you can use to be more efficient and effective, giving you more time to spend coaching and mentoring your Green and Black Belts.

  1. Project Tracking System - Free web-based DMAIC project tracking system, with email reminders for overdue milestones and actions, and upload required artifacts and documents with each phase. This will help you keep projects on track and increase the chance of success.
  2. Green Belt Exam Reminder System - Free reminders sent to Green and Black Belts planning to take the ASQ exam. The emails will provide tips, tricks, materials, and expected progress for key dates and milestones leading up to the ASQ exam, so you don't have to remember to stay in touch with your mentees and make sure they are staying on track.
  3. Lean Six Sigma News - Stay up to date on the latest Lean and Six Sigma trends, tips and tricks. Top blogs, articles, tweets and posts from the top experts and consultants across the web, all displayed on one webpage with no effort.
  4. Lean Six Sigma Skills Assessment - Use this assessment tool to provide your mentees with a way to evaluate their skills and experience on a 1-10 rating scale, based on four major categories: Lean, Six Sigma, DfSS and Soft Skills.
  5. Training Material Powerpoint Templates - Download powerpoint training templates to avoid wasting time creating training material from scratch. Simply add your company logo, review the slide notes, and you're ready to teach topics such as: DFSS, Control Charts, Capability Analysis, 5S, Lean Six Sigma, Cost of Poor Quality, and Root Cause Analysis.
  6. Facilitation Tools - Order items to help you facilitate lean events, such as resusable dry erase sheets, post-it notes, clipboards, VSM data box templates, and more.

Here are some new resources we are working on this year:

Training Reminder System - For each class you teach, setup a checklist to send email reminders as your training class progresses towards the date of the class. Tasks such as:

  • Check attendance list/sign ups (2 weeks prior)
  • Print training materials (1 week prior)
  • Send reminder email and attachments to attendees (2 days prior)
  • Send contact information to attendees (1 day after)
  • Send survey to attendees (2 days after)
UPDATE 7/5/14: The class reminder system is now up and running! Check it out at LeanSixSigmaProjects.com >>>
Cause and Effect Prioritization Matrix - Project hopper tool to prioritize projects based on customized criteria and ranking scores, to help determine the best Green and Black Belt projects to work on.

If you are interested in the new tools, sign up for our mailing list to get notified when they are released. If you have other resources you need to make your job easier or more effective, post your ideas below in the comments.