Saturday, May 3, 2014

15 last minute tips before taking an ASQ Green or Black Belt exam

You've been studying for the ASQ Green or Black Belt exam. You think you're ready, but you're nervous that you overlooked something, or will make a mistake that prevents you from getting certified. Here are some last minute tips to consider, to put your mind at ease. Many of these tips can be used for any exam, but we're targeting those taking an ASQ exam.

If the exam date is months away, or you're just considering the exam, we have provided some tips and reference material for those taking the Green Belt exam on our website at: http://biz-pi.com/certification.asp

If you've decided to take the exam, check out our newly launched "ASQ Six Sigma Exam Reminder System," which provides you with timely updates in your inbox leading up to the exam date. Learn more at: http://biz-pi.com/exam_reminders.asp

The exam is coming up soon. Am I overlooking or forgetting something?

Here are the last minute tips I tell people a couple days before the test.

1) Know your reference material
Don't forget your reference materials and books. You can bring as many items as you want, but if you bring more than 3 things, you have too many. Definitely bring your Primer booklet, however any sample questions and answers from the practice exam must be removed. For reference books (see list of recommended Green and Black Belt books), you should have post-it notes or colored flags to mark and label important sections (see image at left), so you don't waste time searching for the answers.

2) Bring the correct supplies
Bring at least two pencils with good erasers and plenty of lead, and a calculator you are familiar with that has newer batteries. You will be provided with scratch paper that you will need to turn in when you're done, so you don't need to bring paper.

3) Pace yourself
Bring a watch or cell phone, so that you can properly pace yourself, so you don't lose track of time. Here is the takt time for both tests, which is how much time you have to complete each test. You should check after every 30-60 minutes where you are at to make sure you are ahead of schedule.

Green Belt: 144 seconds per question (2:20)
  • 100-question, 4-hours
  • 240 minutes / 100 questions
  • 2.4 minutes per question, or 2:20 or 144 seconds
Black Belt: 96 seconds per question (1:36)
  • 150-question, 4-hours
  • 240 minutes / 150 questions
  • 1.6 minutes per question, or 1:36, or 96 seconds

So you need to be quicker than you were with the Green Belt exam, in addition to the tougher questions. If you don't know what takt time is, review the section on Lean. 

4) Stay positive
If you think you are going to pass, you will be more relaxed and more likely to succeed. Maintain a positive attitude even when you're struggling, and try to stay relaxed. If you start to feel nervous take a few deep breaths to relax, or stretch for a few seconds.

5) Start with the easy questions
Don't stay on a problem that you are stuck on, especially when time is a factor. Since it is multiple choice, if you run low on time, you can always guess at the hard ones. All questions are equally weighted, so the easy questions are worth the same as the hard ones. If you skip a question, put a star or mark it so you can quickly find it (both on the question booklet and the answer sheet).

6) Take your time 
Pace yourself, don't rush. Read the entire question and pay attention to exactly what they are asking for, which might not be what you read the first time. The exam will have questions that seem tricky or worded in a way that may be confusing. Don't skim it or make assumptions about what the question might be asking.

7) Focus on you
Don't worry if others finish before you. Focus on the test in front of you, and how you are doing. Use the full time allotted if possible, to increase your chance of getting the best score possible, as exams are ranked based on complexity/difficulty. Learn more at: http://asq.org/cert/faq/exam-grading-process-detailed

8) Inspect your work
If you have time left when you are finished, look over your test answers. Make sure that you have answered all the questions, since there is no penalty for guessing. Watch out for careless mistakes (misaligned answers with the question number, especially if you skip questions). Ensure that you fully fill in the ovals so you get proper credit, and fully erase answers you decide to change.
9) Eliminate poor answers
Since the exam is multiple-choice questions, the process of elimination can help you choose the correct answer. Start by crossing off the answers that couldn't be right. Then spend your time focusing on the possible correct choices before selecting your answer. I prefer to cross out the ones I eliminate, so it's more visual.

10) Breaks may be worth the time
Take a break during the test if you need it. A five minute break may seem costly, but it can refresh your mind, and help you break from a stressful situation. Even standing up and doing a quick stretch can be enough to get your mind back on track.
11) Get to bed early
This seems obvious, but many people try to get as much studying in the night before, and it can do more harm than good. Your brain and body need sleep to function well, so don't stay up late!  In fact, go to bed earlier than you normally do, as you may be nervous or have trouble falling asleep, so the extra time might come in handy. Cramming is not helpful for these exams, since memorization is not important.

12) Know your exam location
Do you know where the exam is taking place? If you have never been there before, go visit the location so you know how long it takes to get there. This includes finding the actual exam room, not just the building. The exam date is not the time to get lost or take the wrong road.
13) Eat a good breakfast
Don't skip breakfast the morning of the test. Hunger can cause distractions, and drain your energy. Consider bringing something to eat like power bars, candy, snacks and/or something to drink.
14) Arrive early
Get there early to allow for unforeseen problems (accidents, construction, car issues, etc) that can stress you out or make you late. This will also give you time to review your notes right before the test, so your brain is ready to go.

15) Set multiple alarms
The last thing you want is to oversleep and stress out getting there, or worse, arrive late and not have time to finish. Set multiple alarms, and have someone else make sure you are up by a certain time. This is a significant and important test, so take every precaution you can.
 Hope these tips are helpful to you. Did we forget some tips that you feel are important? If so, leave a comment below. Good luck!!

Saturday, April 19, 2014

Adding comments that move with the data in Excel SPC control charts

When you first start out implementing Statistical Process Control (SPC), it is unlikely that your company will invest in a powerful software package. Most likely you will start out using paper and pencil method or Excel, because there is no external payments required to get started (labor only).

You can manually create columns in Excel to calculate the control limits for your chart, since Excel can quickly provide a line chart. To help you avoid creating the control limits and chart yourself, you can download a simple Excel file of an Individual Control Chart for free >>>

One of the biggest limitations to using Excel is the ability to identify out of control points. I don't have any great solutions for this unfortunately. This is why a software package like SigmaXL is ideal, which is an inexpensive Excel add-in (under $300). The work around to this limitation is to train your employees on the Western Electric or Nelson rules, and provide a handouts for them to reference (somewhere near the location of the control charts for quick access). Even with lots of training, out of control conditions will be missed or incorrectly identified.

The next limitation is the ability to mark the out of control condition with a comment about the assignable cause or corrective action (also known as OCAP or out of control action plan). Until recently, I would make a comment in Excel by inserting a text box into the chart. However, as you add more data points to your chart, the text comment does not move with the out of control point. You have to manually move it, which is a pain, and probably won't be properly maintained.


There is a solution to this problem! 

First, we need to isolate the data point you want to assign the comment. Click on the data point in the Excel chart, which will highlight all the chart data points.


Next, click on the same data point a second time, to isolate only that data point. Otherwise, the changes will be applied to all points (which we don't want).


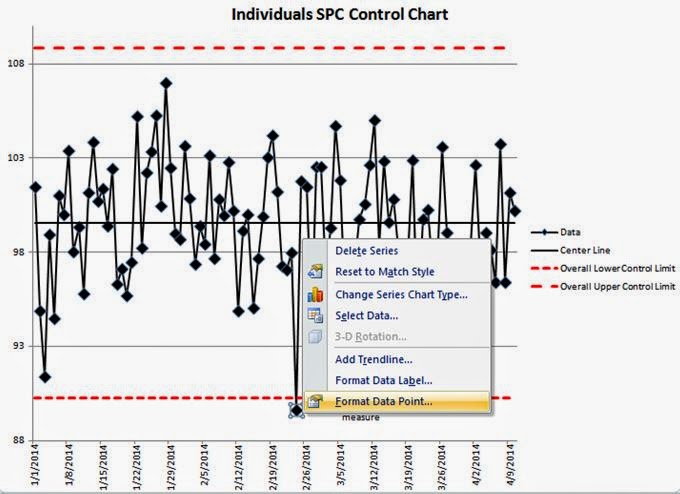
Next, right click on the isolated data point. You should see the following menus appear. 


Next, select the "Add Data Label" command.  

This will assign the actual data value to your data point. Click on the data value to edit the value, and write in your comment. 


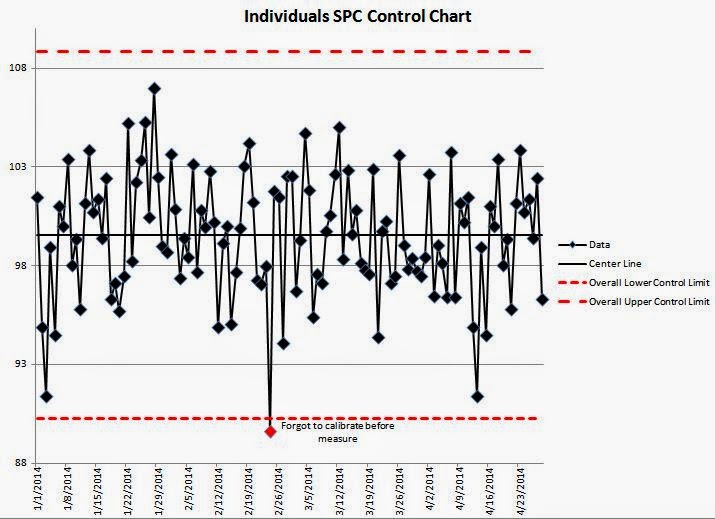
We entered "Forgot to calibrate before measure" as the new data label. This will keep your comment aligned with your data point, even when new data points are added. In the chart below, we have added 20 more data points, but the comment stays connected with the out of control point. Problem solved!


I would also recommend changing the data point color of the out of control condition (as shown above), so it stands out, and you can show others that it was identified. 

Simply right click on the isolated data point (make sure it is the only point highlighted).


Next, select "Format Data Point..." then click on the "Marker Fill" section


Select "Solid Fill" and then select the color of the data point. Red is a commonly used color for out of control points.


As a reminder, here is the link to this free simple Individuals control chart template for download >>>

If you would like to train your employees on Statistical Process Control (SPC) Charts, purchase our training Powerpoint template >>>

Have you found any other tips for control charts in Excel?

Monday, April 14, 2014

How to increase the number of graphs you can display in Minitab beyond 100

With an increasing amount of data being collected and analyzed these days, I often run into the restriction in Minitab that you can only have 100 charts displaying in the project file at any given time.

There is a way to change it in the Options settings.

Go to Tools --> Options


In the Options section, select Graphics --> Graph Management


In the field called “Maximum number of graphs:” at the very top, change it from 100 to whatever number you need, such as 250 or 500. I would suggest only the number of variables in your data set, so you don’t use up too much memory or storage space in your file, as it will take longer to save and open in the future.

This number will be saved as the default setting for Minitab going forward, so you don’t need to change it every time.

There are other options for dealing with graphs that you can change on this page. I would leave the default settings until you become more familiar with Minitab and know what changes you are making.

Do you have any other Minitab tips you'd like to share?

Thursday, February 13, 2014

What if you can't find a Green Belt project for certification?

When promoting Six Sigma certification, we rarely have difficulty getting people interested in the idea. With opportunities to increase your salary $4000 to $7000, get promoted, improve your problem solving skills, and boost your resume or C.V., most are willing to put in the hard work to obtain a certification, especially at the Green Belt level.

The biggest problem we run into is helping people find a project to work on.

"Do I have to do a project, can't I just take the training and take a test?"

Projects are important to allow you to get an opportunity for hands-on experience applying what you have learned in the training. The real world is much different than the textbook examples, so it's important to learn how to take the concepts and figure out how they fit into your company, job function, and industry. This also provides you with an opportunity to explain these concepts and ideas to your co-workers and management, who may know nothing about Six Sigma. This also helps the learning process when you have to explain it or teach it to someone else.

 six sigma shift explanation


In addition, the training you receive will not make complete sense until you are analyzing your own data that you are very familiar with. This allows you to compare your current approach to analysis against the training, to see how the analysis confirms or conflicts with your initial interpretation. That is where true learning takes place.

To help you brainstorm some ideas for defining a project, we put together a few example projects we found online. Most training classes show manufacturing examples, but the majority of the opportunity in the world is outside manufacturing (service processes). It can be difficult to figure out how to select a service related project, so these examples should give you a few ideas.

Hopefully you see the value in doing a project along with the training.

"But I can't find a project to work on"

What if you can't get support for a project from your current company? Is that fair that you are stuck with no options? You want to learn the tools to help you with your day-to-day problem solving, and enhance your chance for promotion, but if your company won't give you the time, direction or support for a project, now what?

There is a Green Belt certification option through Lean Sigma Corporation that does not require a project. Instead of a project, you complete 17 modules, go through examples and exercises using Minitab or SigmaXL, take interactive quizzes, and complete tests at the end of each phase. You also need to get a score of 80% or higher on the final exam (150 questions over 2.5 hours) in order to become certified.

The certification is recognized globally, and covers the body of knowledge from both ASQ and IASSC. It is accredited by The Council for Six Sigma CertificationThey also have an option to have a Master Black Belt mentor and guide you through the training and your project (if you choose to have one), reviewing each phase and your artifacts, to make sure you're ready to move on, and understanding the tools and concepts correctly.

A demo of the online training system is also available on their website


We still feel that a real project is the best way to go to get the most out of your learning experience. Even though the online certification program does not require a project, you should still try to get one defined and completed, so you have some true improvements to show your employer (or future employer). However, we know that isn't always possible, especially if your company does not support your training and certification. It can be a catch-22 if your company doesn't give you the time or support to take training and get certified. You might feel stuck, in that you want to be able to do more process improvement projects in your future job, but you can't get hired into a position to do that without a certification. The online Green Belt certification option can help address this dilemma, and get you moving in the right direction.

Let's summarize the information in this article:

1) Green Belt certification is an excellent skill set to have. Find general information about Six Sigma certification

2) Training is highly recommended along with an improvement project. See examples of projects


3) If you can't get a project, but want to move forward with a project, check out the online Green Belt certification. At your earliest opportunity, apply your new skills to an actual project.


If you don't like this option, we also compiled a list of other Green Belt certifications that might meet your needs, budget or schedule.

Good luck! The journey is challenging but the majority of people find it rewarding and they were glad they went through it.

Thursday, December 26, 2013

Ideas for airlines on how to make lines and wait time shorter for passengers

As an avid airline passenger, I’ve flown on many different airlines (most major airlines) and visited many different US airports (and a few international airports). What I've noticed is that the process of how to get checked-in, through security, and loaded onto the plane seem to be ripe with opportunity.

Let’s break this down into three major processes:

  • Checking in
  • Going through security
  • Loading the plane.

Checking In

This area has been steadily improving over the past few years, especially with online check-in and electronic ticketing. I actually don’t have many complaints with this process (unless the airline is not using these options). The best situation is when the check-in kiosks are separated from the line. I dislike when you have to wait in a line that has both people waiting for kiosks, and those with questions for the attendants. It gets confusing, and slows down the process for those only needing the kiosks. There are also people who aren't paying attention when a kiosk opens up, so you have to try to get their attention. I also prefer when the airline takes your checked bag after you weigh and tag, instead of giving it to you to give to security. I think that has gone away now, but it was a bunch of wasted steps.


Going through security

My observations and experience with going through the security line is that the line slows down due to the natural variation (common cause) in the time it takes passengers to get organized and loaded onto the conveyor belt. Each passenger is quite different on how long it takes to remove their clothing items (coats, belts, watches and shoes), take out their liquids, take laptops out of bags, take out coins and money, and get their baggage placed on the conveyor. Today, it's a high pressure race to get things off and out of bags with no room to maneuver, and no place to set things. It’s the most stressful part for me when I fly. People are constantly pushing to get their bags on the conveyor behind me. While under pressure, you will ultimately forget your belt or something in your pocket, and have to go back through (rework).


I'm guessing that the scanning process of the bags is most often times the bottleneck, so if we apply the theory of constraints to this issue, the baggage scanning should never be waiting for any bags, yet it is often times idle, due to this variation in passengers getting prepared for the scanner.

I would like to see a staging area after you get your ID and ticket checked, where you can take as long as you want to get all your stuff organized into the trays. I would like to see a big open area with table and chairs where you can sit down, open your bags and pull out the liquids, take off your shoes and laptop, and go at your own pace. Similar to the seating you have after the security line.  This would be helpful for all travelers, but especially elderly, those with children, or those with lots of carry-ons.


When you are done, then you get in line for the X-ray scanning (could be multiple lines to choose from), and it's much less stressful. The only downside is moving your bags and trays back to the conveyor, but hopefully it could be placed close enough to the conveyor where that would not be a huge issue.

By the way, the new pre-check TSA system (keep on your shoes and belt, your laptop in its case, and your 3-1-1 compliant bag in your carry-on.) is awesome, and I hope they roll that out as the standard process in the future!

Loading the plane

I like the idea of loading the window seats first, then the middle seats, then the aisle seats, starting from the back of the plane, and working forwards.

A variation of that was developed by Dr. Jason Steffen, where the rows and sides of the plane are alternated, to create more space between passengers to allow for maneuvering and room to store bags in the overhead.

You can see Steffen’s method in the video below.


When the airlines started charging more for checked bags, this made the loading time much longer. I don’t understand why they did this, other than it was less costly for them (although I’m not quite sure why).

One possible reason for this change is that it will force people to reduce their total amount of luggage. I’d be curious to see if this has happened, or if everyone has just tried to cram their luggage into a carry-on. This has definitely increased the time to load a plane, and now more people are forced to have their carry-on luggage checked at the gate instead, since there is no more room on the plane. This leads to delays while they roam the overhead units looking for space once they are already in the plane, then it leads to rework where passengers finally realize it is full, and have to get their bag back up to the front of the plane to get it checked. I think they should require us to check all our bags, so you only get a personal bag. Let the baggage handlers do their job (which they probably do pretty efficiently), and reduce the amount of time needed for loading the plane.

The only other option I can think for this rule change is that the airlines are saving money with the baggage handlers, therefore if less bags go through the checked bag process, then they will need less workers. This seems to be the most logical reason to me. Unfortunately, this kind of solution is typical of many companies we work with, who try to save money in one area, and it makes the problem worse in another area. The worst part is that they are pushing the problem to their customers, which is the last thing you want to do.  This has to impact the airline’s ability to turn around flights with the longer loading times, which could reduce how many flights occur per day ($$$).

If you're trying to save fuel by reducing baggage, I like Samoa Air’s approach of charging airline ticket cost based on the total weight of the passenger, which includes their own weight and the weight of their baggage. If weight is indeed a big driver of airline fuel spending, then this makes the most sense.


It might be controversial when people are individually being weighed, but I think it’s the most fair from a price perspective. Then it doesn’t matter how many different bags you bring, you are responsible for the total weight.

One other issue I have with loading the planes is when they call out the group numbers. I like the group number idea, but there are two issues:

1) I am never sure what group number was called (audio is poor quality, wasn't paying attention, etc). There is no visual indicator about the current group number. I'm not the only one either, since I always see people asking each other what group number was called. A simple group number on the display boards would make a big difference.

2) The bigger issue is that everyone clusters right near the ticket agent, so often times I think I'm in a line heading towards the front, when in fact the people ahead of me are not in my group, and are blocking the way. When I realize the line at the ticket agent has cleared and the people ahead of me aren't moving, it's too late to get through the cluster, and they quickly call the next group number. Now I'm in the middle of the next group.

United Airlines actually has a good visual control to solve both of these problems...


They have markers for each group number (including first class and preferred boarding), so you simply get in the line associated with your group number, and there is no confusion as to which group is being loaded currently. They are the only airline I have seen doing this.

Finally, a quick note about unloading the plane. It would be nice to require everyone to stay in their seats, to allow "pre-authorized" passengers with short layovers to get off the plane first. This was done during one flight I was on, and it seemed to work really well. There were probably some people who didn't have short layovers that got off in the early group, but I think it worked for most of the people trying to catch their next flight. I think they set the cut off for those with a layover of 30 minutes or less. This would reduce the number of missed flights and reschedules, plus increase customer satisfaction. The rest of the passengers seemed to be OK with this idea, since they probably wished someone had done that for them when they were in the same situation. They only had to wait a couple minutes, so it really wasn't much of a delay for everyone else. We'll see if this idea catches on...

Many of you are avid travelers. Do you agree with our ideas? What are your recommendations?

Update: Here is an article from Portland International on some of their efficiency improvements in different aspects of the airport >>>

Monday, December 23, 2013

Top 3 things to validate before removing test or inspection steps

A process with excellent capability usually means there is a very small probability that the natural variation of the process will exceed the specification limits. Without getting into a detailed discussion, let's assume you are calculating Ppk for this process. We will discuss Cpk and Ppk confusion at another time, but PQ Systems does a good job of explaining why we will be using Ppk for this discussion:
Estimated sigma and the related capability indices (Cp, Cpk, and Cr) are used to measure the potential capability of a system to meet customer needs. Use it when you want to analyze a system's aptitude to perform.
Actual or calculated sigma (sigma of the individuals) and the related indices (Pp, Ppk, and Pr) are used to measure the performance of a system to meet customer needs. Use it when you want to measure a system's actual process performance.
Most customers would like Ppk to be 1.33 or greater (4 sigma), where the probability of having a failure is less than 1% (99.38% success), even with a process shift of 1.5 standard deviations. If you improve the process even further, you might even achieve 6 sigma, which would be a success rate of 99.99966%. This also depends on your industry, as some lower volume industries might accept a lower Ppk, while higher volume production may require Ppk greater than 2.0.

For the purpose of this article, let's assume the process has been in place for some time (full rate production levels), not a discussion during design and development of a new process or product. In addition, even if your process has a 100% yield does not mean it has good capability. Therefore, a pass/fail step should switch from attribute to variable data collection if possible, so Ppk can eventually be calculated.


At some point, the chance of having a failure is so small, that the question comes up from management: "Why are we still testing or inspecting this characteristic, if it is unlikely to fail?"  

Can the test or inspection be eliminated completely? Can we reduce it from 100% down to 50% or 25% or 10%? From a lean perspective, inspection and test are non-value added but necessary (avoiding problems from getting to the customer or further into the process), but perhaps these steps are not even necessary because the process is so good.

In most cases, the end customer will have some say in this matter, especially if they provide the requirements to you. By default, they will be highly resistant to any test or inspection removals. It adds risk to their processes, and they usually don't see any benefit. 

Given this resistance, what evidence is required to alleviate their concerns, and allow approval of a reduction or elimination in a test or inspection step?

We have not found any formal documentation on how to deal with this situations. If someone has some guidance (any industry), please let us know so we can share with our clients. 

Here is our typical response when asked this question...

There are three areas to look at to prove test or inspection reduction to a customer: Stability, Capability and Risk Mitigation.


  • Stability: Consistent process data results (no outliers and no trends or shifts on the control chart) that have been happening over a "long" period of time (varies by industry). Ppk calculations assume a stable process, so stability provides confidence that the calculation of Ppk will be maintained in the future. This also implies a sufficient sample size has been obtained, that clearly shows the underlying distribution of the data (normal, weibull, lognormal, etc).
  • Capability: Good capability results (Ppk > 1.33 minimum, but preferably over 2.0, which equates to Six Sigma performance). Ppk calculation is also based upon an assumption of normality, so if that's not valid, the Ppk results may be incorrect.
  • Risk Mitigation: Clear documentation of how the process will not produce defects, shift, trend away from the average, or increase in variation in the future. Typically this involves evidence of mistake proofing, SPC knowledge, and operator training.

  • Even if there was some clearly defined process for making this decision, an agreement between customer and supplier will always be required. We recommend you have this discussion as early as possible before preparing a package, to make sure the customer will consider this option, and the amount of evidence is agreed upon ahead of time. There may be very high severity characteristics (safety critical or operation critical) that will be difficult to justify for sampling, even with high Ppk values, due to the severity of even one escape.


    Example

    Let's look at a generic example, and see how we compare against the three criteria. Let's assume you have an inspection process that measures the gap between two parts. The gap is recorded into a database, and the results are tracked on an Individuals and Moving Range chart (SPC control chart). 


    Stable? 

    As you can see, there is no out of control conditions identified on either chart, so we feel confident that the process has been stable during the time period of this chart. Let's assume this is a six month history of 100 data points.

    Capable? 

    Since we've already shown a stable process, we next check the normality of the data. The chart looks good, but technically it fails the normality test. However, this is due to the resolution of our data. If we go one more decimal point, the normality test passes. Therefore, our data is normally distributed.


    Next, we look at the capability histogram compared to the customer requirements, and look at the Ppk calculation.


    Clearly, the data falls well within the lower and upper specification (tolerance) limits of 15 +/- 0.20. 
    Ppk is calculated at 2.40, which is better than a six sigma process. There would be a very remote chance of a failure due to random chance. Therefore, the process is considered capable.

    Risk Mitigation?

    Now that we have capable and stable performance, we still need to give the customer confidence that we can maintain this performance into the future. 

    We recommend including the following information in your discussions and proposal:
    • List of past defects and outliers, along with root cause corrective action that includes a mistake proofing device implemented to prevent recurrence.
    • Operator and engineering records on SPC training classes completed.
    • Documentation showing how the operator enters data, reviews charts for out of control conditions, and takes action when required.
    • Updated PFMEA with a history of completed actions that reduced the highest RPN scores, and regular meeting minutes showing updates to the PFMEA with a cross-functional team.
    • History of SPC charts on this process, to prove that the SPC charts are not brand new, and that the common and special cause variation has been improved over time.
    • Operator training program, to show how new employees are properly trained and supervised with regular oversight until skill competency is proven.
    • Good documentation and work instructions on the process (mainly pictures, clear explanations, cautions, color-coding, etc), to give confidence that a new operator would not produce defects.
    • Key parameters that have been flowed to the supplier to help control variation on this measurement.
    • History of a stable supply chain (no recent supplier changes or disruptions).
    Not every single one of these will be required. Some customers might ask for more than this. However, the more you can complete and provide with your proposal, the higher the probability it will be approved. Want to improve your chances even more? Show the customer what cost savings you can provide to them by reducing or eliminating the step!

    Most likely, the first request for elimination will be rejected by your customer, but hopefully they will agree to a reduced sampling plan (check every other part, instead of every one). After a few months of success, maybe every 4th or 10th part will be checked, until eventually the test or inspection is eliminated.

    Conclusion

    Without any clear industry documentation or guidance on how to reduce or eliminate inspection or test in your process, we hope this provides you with a starting point, to see if your process is eligible or not. The more evidence you can share with your customer regarding stability, capability and risk mitigation will increase the chance that they will agree to a reduction or elimination of a test or inspection step. Giving the customer a financial incentive to approve doesn't hurt either...

    What are your experiences with this? Have you been successful? Does your customer refuse to accept any evidence?

    Sunday, November 17, 2013

    How to calculate time savings after reducing distance traveled

    One of the goals of a lean kaizen event is to reduce the overall lead time, from when an order is officially placed by your customers, until you deliver the order to the customer. The longer the lead time, the more money your company needs to have in cash flow and inventory to account for this delay.

    Typically, the lead time is significantly longer than the actual time to produce the product or service, often times 10-20X longer than the cycle time (only 5-10% of the lead time is spent working on the order, the rest of the time it sits or gets moved around the facility). For example, if your process is 5 steps, and each step takes one hour to complete, it is not surprising that it can take 50 hours or longer to process an order through the system (5 hours of cycle time x 10 = 50 hours).

    One of the first improvements you can make to your process is to reduce the time spent BETWEEN the process steps, in order to reduce the amount of delays and excess transportation in the process.


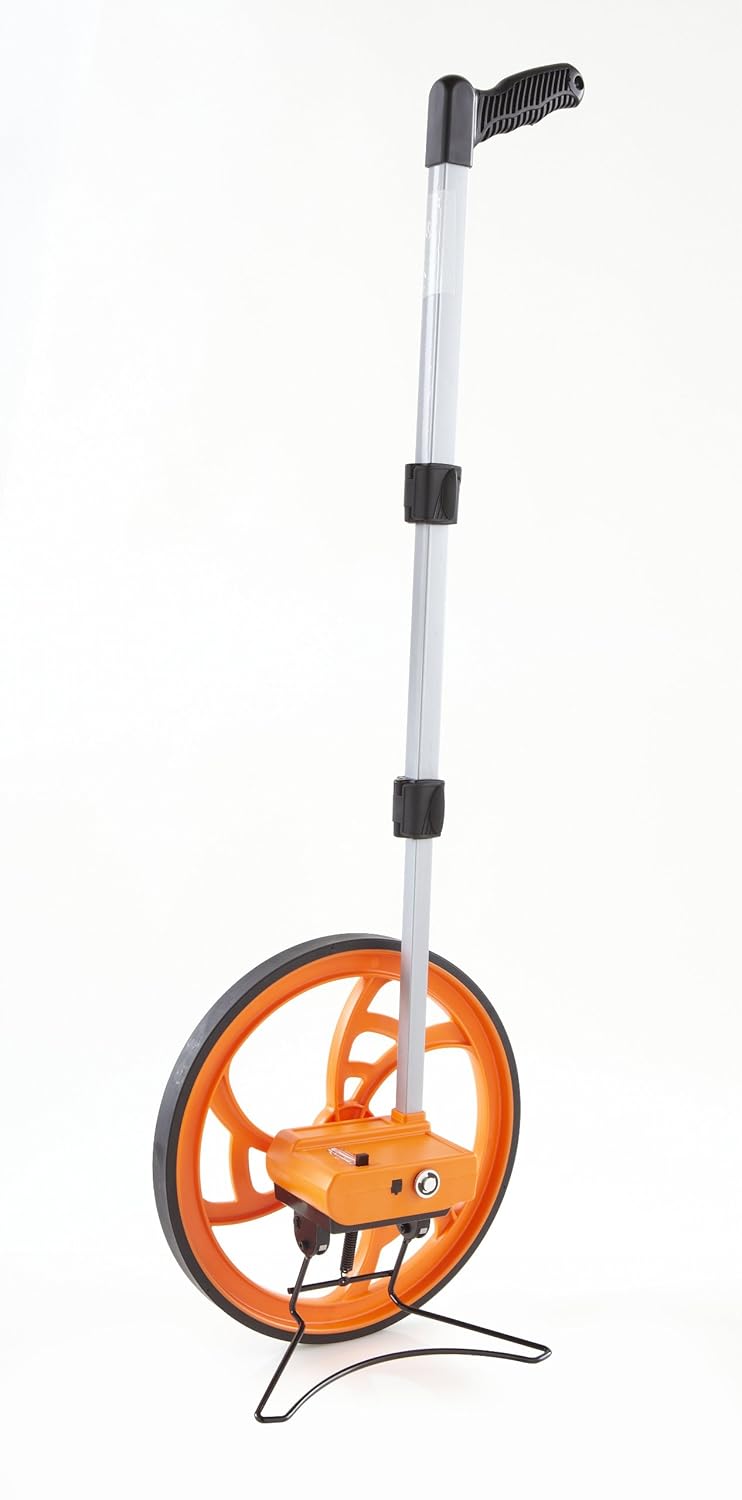
    This can be measured by using a distance measuring wheel to follow the flow of products or people through the process, or measured by AutoCAD or tape measure. The total distance traveled can be calculated before and after the improvements to determine time savings.

    According to the book Making Materials Flow, each step of walking is equivalent to 2.5 feet. Each step (2.5 ft) is equivalent to 0.6 secs. If you use the metric system, one step equates to 0.762 meters. Said another way, for every 4.166 feet traveled (1.27 meters), one second of time is wasted.

    Therefore, if your process distance traveled is 10,000 feet per day, let's look at the calculations:

    10,000 ft / 4.1667 ft/sec = 2400 seconds = 40 minutes = 0.67 hours

    3048 m / 1.27 m/sec = 2400 seconds = 40 minutes = 0.67 hours

    Next, you can multiply your labor rate x the number of hours of travel. For example, if the labor rate is $30 per hour (including all benefits), then $30 x 0.67 hours = $20 of wasted time per day. If you work 20 days per month, then the cost is $400 per month wasted due to travel.

    Any other calculations you've used to capture walking distance savings?